Visualising The Flow
Value Stream Mapping
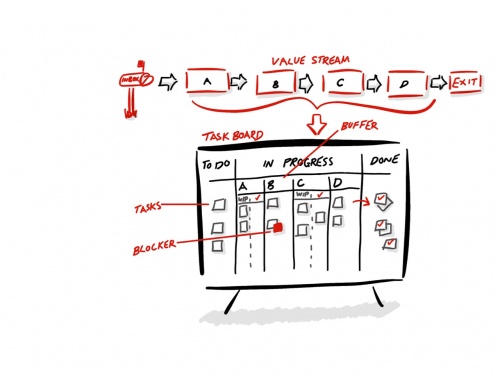
The Value Stream is the process flow of how work arrives at a team, what work is done in the team, and how it leaves the team. Visualising this workflow allows teams to understand waste in the system and enables decisions, enhancements and adaptations to be made to reach an optimum flow.
Kanban Board
A good way to visualise the value stream is to represent the processes in the flow as separate columns in a task board or card wall. As cards that represent the items of work are moved through the columns, then this gives a sense of where the work is relative to the process.
Adding in queues and buffers to the card wall then provides a good representation of where work is done and where it waits ready to be pulled into the next queue.
- Queues on a card wall are simply where work happens and are an active part of the process flow.
- Buffers by comparison are where work is waiting to be pulled into the next queue.
Concurrent and Parallel Processes
Two approaches to represent parallel processes are to either put the parallel processes together in a single column or represent in stacked columns, one on top of another.
The single column approach allows an ambiguous space that caters for complex interactions between the team as they address the tickets. This is particularly good for teams that need a bit of encouragement to talk and interact more with each other.
The stacked multiple column approach provides an explicit representation of what is happening in each part of the process and is good when an explicit understanding is needed in the team.
Swim Lanes
Swim lanes are great to represent partitions of the work such as when working on several features or on work that relates to different contexts.
Simply draw some horizontal lanes on the Kanban board and then the board is explicitly partitioned for specific contexts.
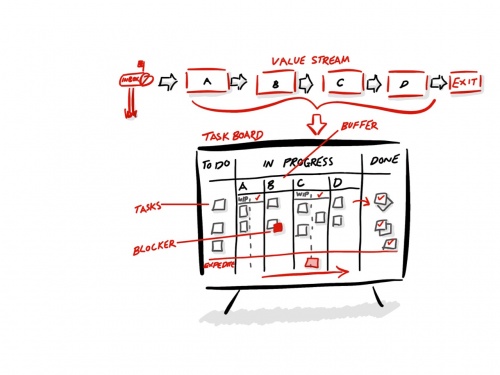
Expedite Lane
Occasionally teams encounter work items that need to be worked on immediately such as production issues, for example. A simple way to represent this is to create an Expedite swim lane that clearly indicates to a team that anything that sits in this swim lane is of automatic high priority.
WIP Limits
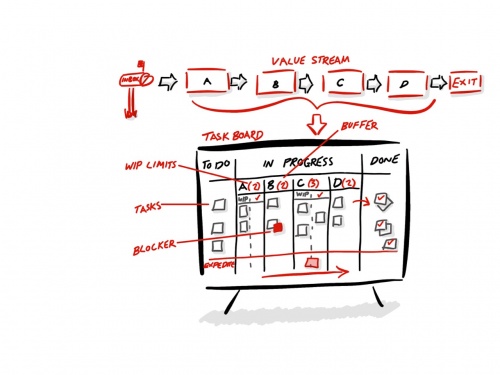
Work In Progress Limits sound like a constraint and a restriction but have a surprisingly positive effect on a team and provide an alternative approach to predictive planning.
Based upon queueing theory the idea is that in a particular queue or column on the task board a limit is set to the capacity or number of work items that can be done at once for that particular part of the process.
Limits can be adjusted at any time and so initially it may be the best guess to get things started, and then adjust there after.
When a WIP Limit is exceeded, for example, when a new urgent card needs to be worked on, this is then a reminder for the team to make a prioritisation decision as to which cards are retained in the queue and which cards are to be placed back into the buffer in order to preserve the WIP Limit. This small prioritisation decision that is done on an as needed basis forms a just in time micro planning event and allows the team to make in context decisions as they are needed.
The same approach can be used when a WIP Limit has not been exceeded and there is an empty spot that can be filled. Here the team can make another just in time prioritisation decision to decide which items from the buffer should be pulled into the queue to be worked on.
This series of just in time planning events allows teams to move away from prescriptive planning events such as Sprint Planning for example which is used as a means to limit the work in Scrum. This is particularly relevant when teams are working with continuous volumes of small work items and when predictive planning can become irrelevant quickly and are a waste in the system.
Work Items
Work items are represented as cards, (index cards or post-it notes are often used for physical boards,)and some of the following common attributes:
- Name - these tend to be more memorable than a number
- Index or Key - these can be an electronic ticket reference if needed
- Description - don't be tempted to write too much, as the less is written the more the team will talk about the ticket and understand it
- Time Indicator - these can be simple dots added to indicate how many days a card has spent in the queue and becomes a visual reference for when a team may want to place cards at a higher priority over other cards
- Avatar - sometimes it works well for team members to use avatars to indicate who is working on which item. (A fixed number of avatars representing the capacity of a team member also helps teams to only volunteer for work for which they have capacity.)
- Blocker Indicator - this may be as simple as a small red sticky note that is highly visible to help teams understand which work items have been blocked and why
Another common form of a work items are User Stories that have some basic structure and are used in conjunction with Test Driven Development (TDD) approaches.
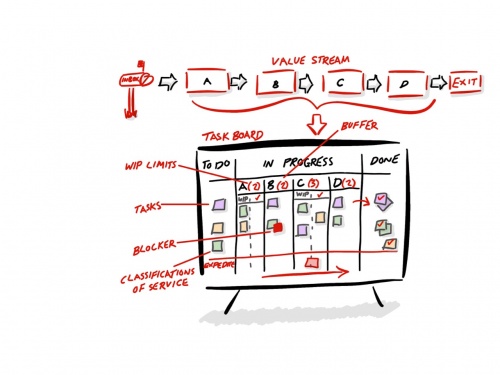
Classifications of Service
Not all work items are the same, with some items being naturally more important than others and automatically placed at a higher prioritisation.
To help with this colour coding the work item cards can help teams to understand which items are more important and of a higher priority over other cards.
No Estimation
If all cards are the same size, then metrics are just simply adding up the number of cards and the activity of estimation, which is rarely correct, can be bypassed and a focus on the value of the work items can be the main focus instead.
An alternative approach:
- each work item is the same uniform size and causes the team to think in depth about the work and how to structure the tickets to achieve the outcome
- the cycle time (time taken for work items to traverse the value stream,)can be used as a Service Level Agreement (SLA) to indicate the statistical probability of how long cards of a uniform size take to complete
- work items are prioritised by business value
See Also
References
- Kanban, Successful Evolutionary Change For Your Technology Business, Anderson D. J., 2013


